Using key claims information from healthcare entities nation- wide, including hospitals, nursing homes, and long-term care facilities, Milliman has built a medical professional liability (MPL) database that contains more than $20 billion in incurred losses for the most recent evaluation date, and includes claims occurring in the last 30 years. In addition to loss data, Milliman collected other details such as claim state and hospital department.
Part of our analysis includes creating industry loss-development factors and increased-limit factors. These become especially critical in instances where a hospital’s data is not credible on its own. Using other specific claim details collected, such as state/region or exposure (hospital, nursing home, etc.), we can develop industry patterns tailored to the specific characteristics of the program.
Lastly, this database has also allowed us to summarize several claim diagnostics that impact the entire MPL industry. Key findings are shown in the figures here.
Large claims
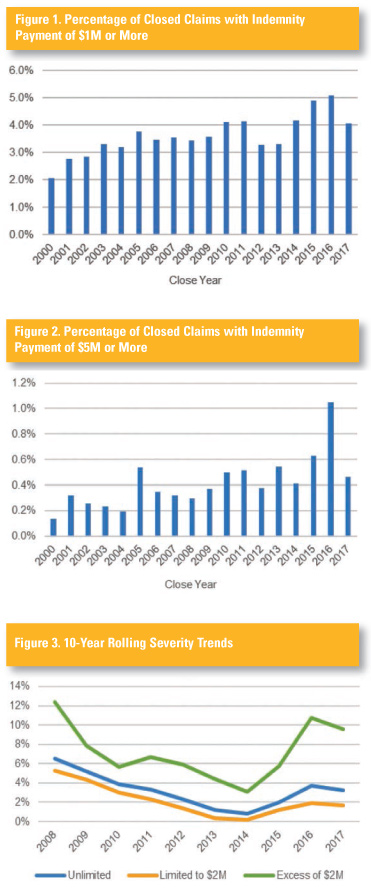
As shown in Figure 1, there has been a significant increase in the number of large claims over the last few years. The percentage of claims that closed with an indemnity payment of $1 million or more was relatively flat between 2003 and 2013, but has increased from 2014 to 2016. There was an even more significant increase in the percentage of claims that closed with an indemnity payment of $5 million or more (Figure 2).
Severity trends
The MPL market has seen an uptick in severity in recent years, as indicated in Figures 1 and 2. Using roughly 100,000 closed claims, the study estimates an unlimited severity trend of 3.5%. This conclusion was derived by fitting incurred losses to an exponential distribution based on the close year of the claim.
Figure 3 presents rolling severity trend estimates, calculated
using rolling trends for 10-year periods. As an example, the 10-year rolling trend for 2017 would be the estimated severity trend using claims closed in years 2008 through 2017. As shown in Figure 3, the severity trends declined from 2008 to 2014. However, the severity trend abruptly changed direction beginning in 2015.
Limited loss and excess loss severity trends are analyzed below. Figure 3 shows rolling severity trends for losses limited to and in excess of $2 million. Both layers of losses contribute to the severity trend shift, starting in 2015. However, severity for losses of more than $2 million is growing more quickly than those of limited severity, exceeding 10% by 2016. Therefore, this analysis concludes that the unlimited severity trend increases are due to the recent increase in very large claims.
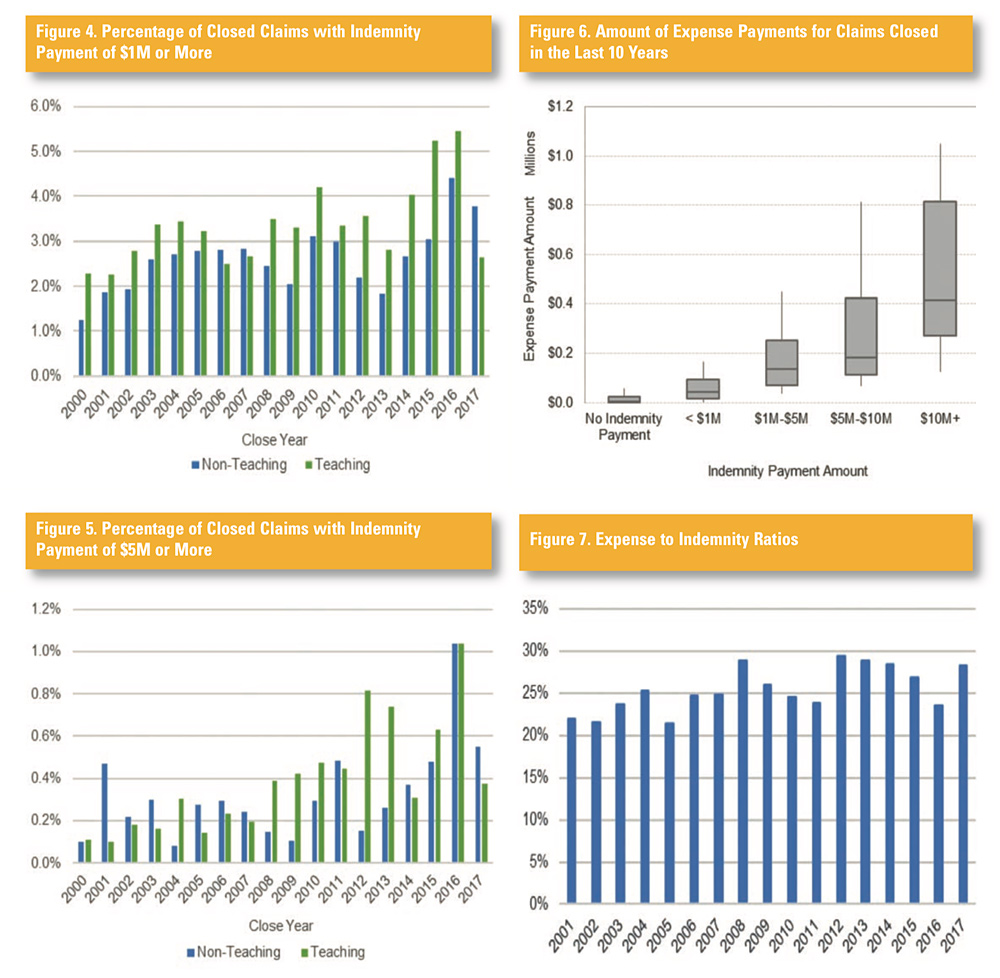
Teaching versus non-teaching hospitals
The average closed claim severity for teaching hospitals is 20% higher than for non-teaching hospitals, over the last 30 years. There is also a higher percentage of large claims at teaching hospitals (Figures 4 and 5).
Expense payment versus
indemnity payment
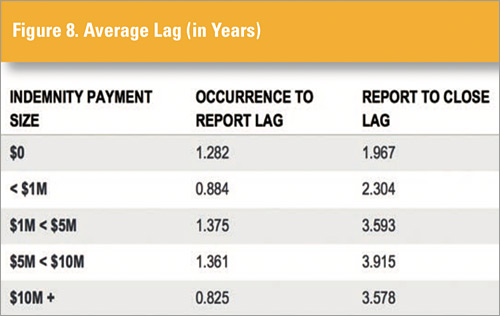
Figure 6 summarizes the amount of expense payments for claims closed in the last 10 years, based on the size of the indemnity payment. As expected, the average expenses increase along with the size of the indemnity payments. The box represents the 25th to 75th percentile, with the line in the shaded box as the median. The top and bottom bars extend to the 90th and 10th percentiles, respectively.
Expense to indemnity ratios
Figure 7 summarizes the ratio of expense payments to indemnity payments for closed claims by close year. With the exception of 2016, the expense ratios are slightly higher, on average, beginning in 2012. The average after 2012 is 28%, which is 4 percentage points higher than the average expense ratio prior to 2012. This increased expense ratio is evident across all segments of the data. In the MPL insurance company space, some companies have used predictive analytics to gain greater insights for managing this expense item, so it is reduced to its historical levels. This use of predictive analysis is in its early stages in hospital, nursing home, and long-term care, a trend that could lead to significant savings opportunities.
Lag by claim size
Set forth below is an analysis of the lag periods, both from occurrence date to report date and from report date to close date, based on the indemnity payment amount. As anticipated, the lag from report date to close date increases as the amount of the indemnity payment increases. Interestingly, the occurrence to report lag is not linearly correlated with the size of the indemnity payment. Claims that end up closing without an indemnity payment typically take longer to be reported than those with indemnity payments less than $1 million. One possible reason is that more of these claims without indemnity payments are reported as the statute of limitations is expiring. It is also interesting that claims that end up with $10 million or greater indemnity payments are reported more quickly than those with indemnity payments between $1 million and $10 million. In some of these more severe cases, it may be more evident to the hospital that a significant incident has occurred and thus it is reported more quickly (Figure 8).
Severity by specialty
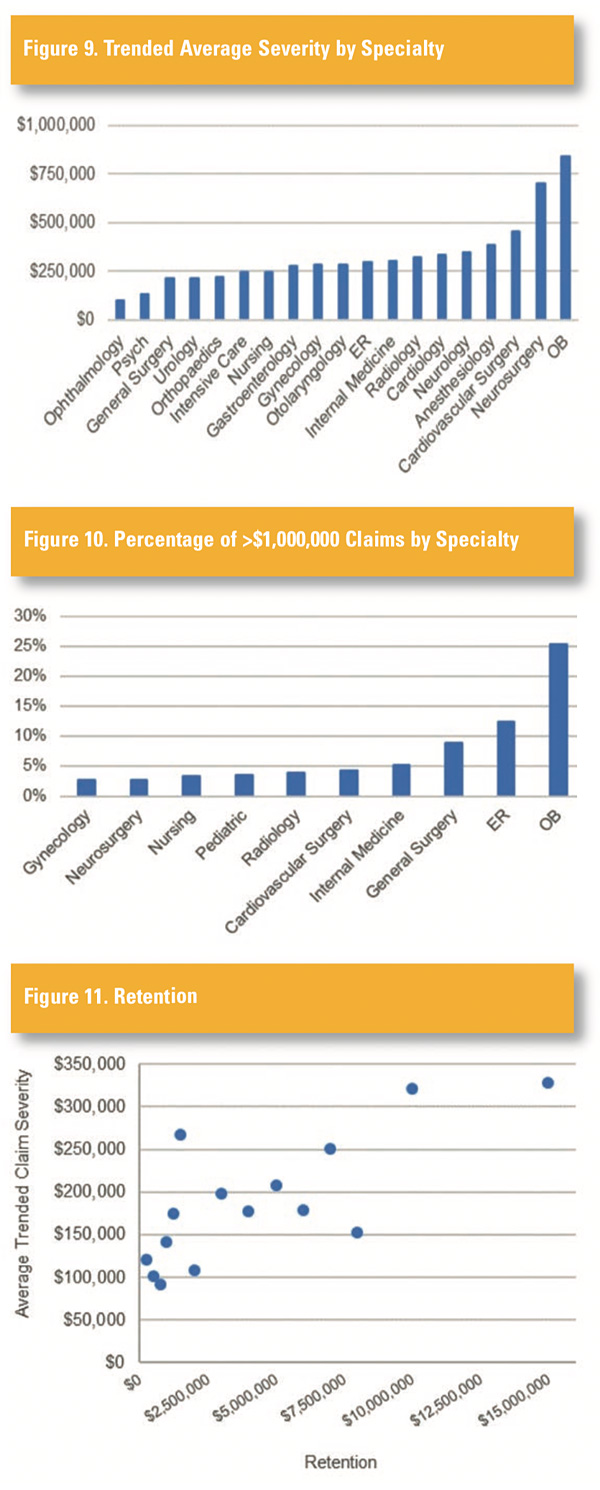
Figure 9 shows the average closed claim severity by specialty, including both loss and allocated loss adjustment expenses. Claims have been trended from their close date to 2018 by 3.5% per year. All specialties shown contain a minimum of 200 closed claims.
Figure 10 shows the breakout of claims greater than $1 million by specialty. More than 70% of claims that exceed $1 million fall into one of the 10 categories shown, with the top four categories making up more than 50% of claims. More than 25% of the claims exceeding
$1 million are obstetrics claims, significantly surpassing those for the next largest specialty, emergency physicians. Each specialty shown
has a minimum of 25 closed claims.
Retention
Figure 11 plots the current retention of each entity along the x-axis
and the average unlimited claim severity along the y-axis. It appears
that the average claim size increases as the retention increases. One plausible reason for this is that the market will force those with a history of large claims to retain more risk. Another possibility is that claims
are more likely to settle at or near the retention, therefore increasing the average claim severity for those with higher retentions. It is also possible that the entities with higher retentions have higher overall coverage limits, which may affect the severity of large claims.