In some ways, there was the continuation of existing trends: continued decline in prior year reserve releases, another year of underwriting losses, and an overall profit driven by investment gains. However, 2020 was also the source of many challenges,
causing interesting and perhaps unexpected results, including a decrease in direct written
premium and reversals in long-term increases to both the combined and operating ratios.
In a year that many believed would generate modest rate increases throughout many markets,
the premium decline that actually occurred may come as a surprise. However, the impact of COVID-19 on the market—both in premium relief programs and shelving planned rate increases for some carriers—likely limited overall growth.
Despite the aforementioned underwriting losses, the MPL industry provided policyholders with substantial dividend payments, especially relative to its net income. This is likely a function of well-capitalized balance sheets and continued competition in the market.
On the surface, those balance sheets appear to have a stronger reserve position at the end of 2020 than at the beginning. The 6% increase in unpaid loss and loss adjustment expense (LAE) reserves is the largest increase since 2005. Part of this is likely a result of updated beliefs regarding reserve adequacy given the reduced reserve releases in 2020; however, COVID-19 related delays in the court system contributed to more open claims than would typically be seen—causing the claim liabilities to remain on the balance sheet instead of moving through the income statement.
COVID-19 may also be contributing to a favorable 2020 coverage year. Although reported claim frequency had largely stabilized in recent years after more than a decade of declines, 2020 saw a dip in claims reported as fewer people sought nonessential healthcare. Despite the improved frequency, the MPL industry has posted an initial loss and LAE ratio in line with recent years. At this point, it’s difficult to determine whether this is a temporary or ongoing trend.
However, severity concerns continue and may outweigh the relief provided by fewer reported claims. Indemnity severity in particular has increased sharply in recent years, first in high coverage layers with “cap buster” claims, and more recently trickling down into lower coverage layers as well. The rise of life care plans has increased the economic damage component of paid indemnity claims such that even some states with noneconomic damage caps have experienced these trends.
As a result, the rate increases observed over the last few years will likely continue in 2021 and beyond. If severity continues to be the driving force in increasing indemnity costs, we anticipate that premium increases will target higher policy limits as well as corporate policies in which limit stacking has become more prevalent in recent years.
We have based this picture of the current state of the MPL industry on the financial results of a composite of 54 of the largest specialty writers of MPL coverage. Using statutory data obtained from S&P Global Market
Intelligence, we have compiled financial metrics for the industry based on:
- Written premium
- Overall operating results
- Reserve releases
- Capitalization
- Policyholder dividends.
In considering the financial results, note that the 54 companies included here are all established MPL specialty writers. The composite excludes any MPL specialty writer that has become insolvent or otherwise left the market as well as multiline commercial writers and smaller writers. The companies in each of these three excluded categories are generally less well-capitalized than the 54 companies included here. In addition, the underwriting results of the multiline commercial writers, as well as some of the smaller writers, have generally been somewhat less profitable. Of course, this was also true for the writers that became insolvent. Thus, the results presented below reflect the experience of the established specialty writers, which is inherently more favorable than a view of the industry as a whole.
Written premium
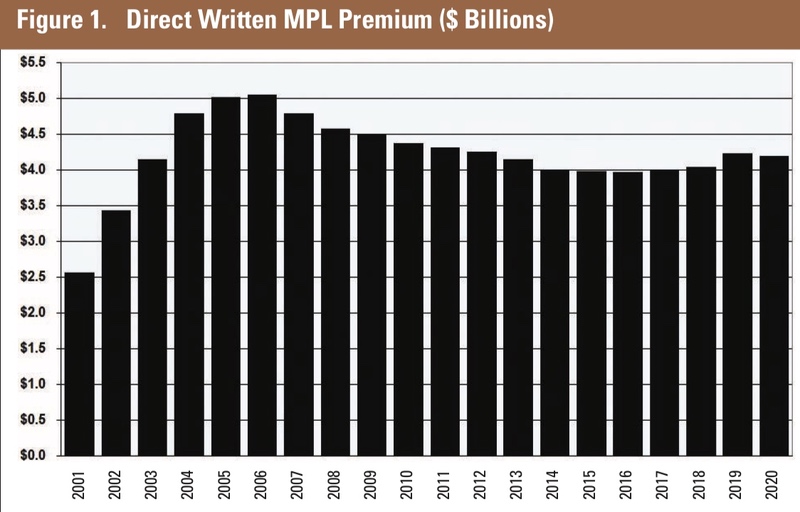 2019 was the first year since 2005 in which direct written premium for the composite increased by more than inflation, a period that included a cumulative 21% decline in direct written premium. In 2020, that reversed itself for this composite of MPL specialty writers (Figure 1). This slight contraction in direct written premium can likely be explained by the COVID-19 impact on the market. In a year that the market was expected to continue hardening, the decrease in direct written premium may be explained by:
- 1. The premium relief granted by many insurers to offset assumed declines in physician practice volume
- 2. Insurers’ reluctance to request rate increases from state departments of insurance in the midst of the pandemic.
Interestingly, a look at the broader MPL industry—including multiline commercial writers—shows that direct written premium for MPL coverage increased in 2020, albeit at a slightly slower pace than during 2019. Non-specialty writers were able to generate new business, increase premium on existing business (primarily for facilities and hospitals), and/or provide less generous COVID premium relief programs than their specialty counterparts. This marks just the second instance since 2002 in which the specialty and non-specialty writers showed changes in direct written premium that were not correlated. The first was in 2017 when it appeared that specialty writers began increasing rate levels more quickly than non-specialty writers,
causing specialty writers to experience an overall premium level increase not experienced by the non-specialty MPL writers.
As the current soft market appears to be drawing to a close, we see notable differences from the preceding soft market of the 1990s through the early 2000s. In hindsight, both soft markets showed inadequate rate levels, but the degree of rate inadequacy appears to be less, and present in fewer locales. During the earlier time period, rate deficiencies—including those documented in rate filings—ultimately culminated in adverse financial results. The reduction in frequency since the early 2000s has put MPL rates in a better position than they were 20 years ago. Nonetheless, we see indications of insufficient premium in a number of markets currently,
although we also see rate action by carriers to address these deficiencies.
Overall operating results
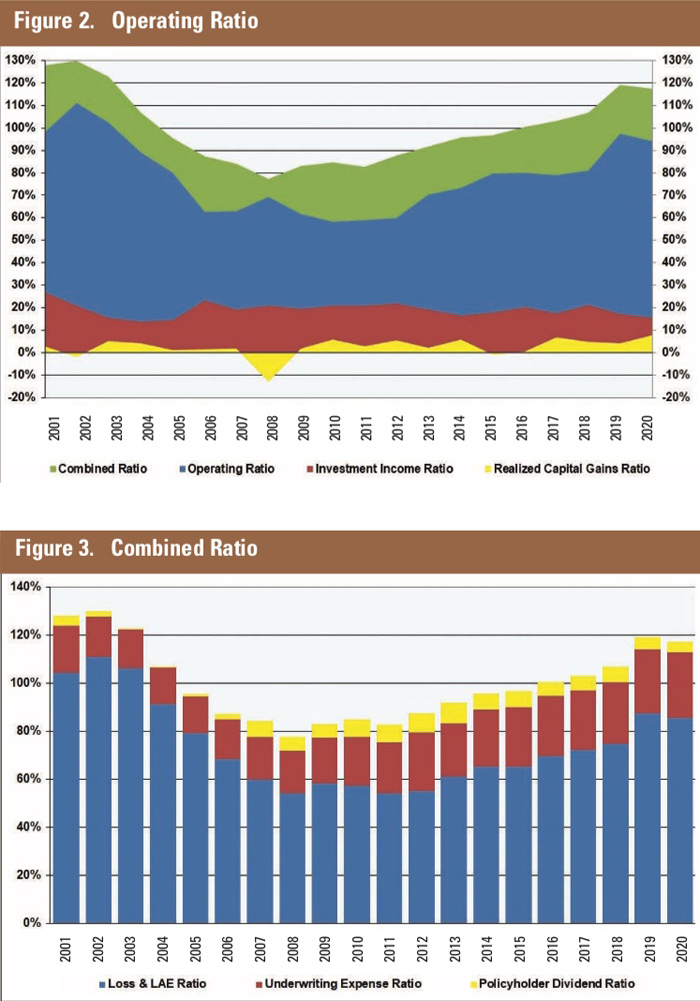 The 2020 operating ratio of 94% is 3 points below the 16-year high of 97% in 2019. This new level in 2019 and 2020 represents a near 40-point increase since the industry’s peak
profitability in 2010 (Figure 2). Increases in the operating ratio had been gradual until the
industry filed 2019 results, posting an abrupt 16-point increase over 2018.
The 2020 operating ratio of 94% is 3 points below the 16-year high of 97% in 2019. This new level in 2019 and 2020 represents a near 40-point increase since the industry’s peak
profitability in 2010 (Figure 2). Increases in the operating ratio had been gradual until the
industry filed 2019 results, posting an abrupt 16-point increase over 2018.
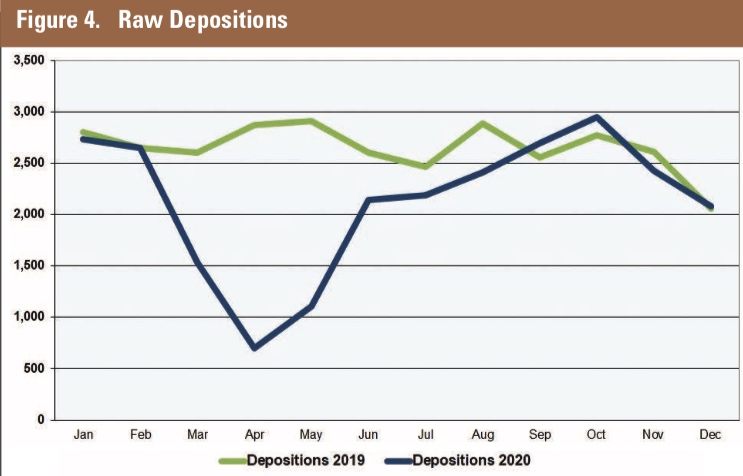
Declining reserve releases, which are the primary driver of the deteriorating underwriting ratio, have been trending downward since 2012. Underwriting expenses have also contributed to the increased underwriting ratio, rising from 15% in 2004 to 27% in 2020. The combined ratios above 100% for each of the past five years (Figure 3) create a reliance on investment income for industry profitability.
Investment gain ratios for the composite have hovered above 20% over the last two decades, and 2020 was no exception, coming in just over 23%. Analyzing investment gains into their component parts reveals that the investment income ratio fell once again to 15% in 2020, its lowest mark since 2005. The composite’s capital gains ratio, on the other hand, increased to 8%, which is the highest ratio in at least two decades.
The 2020 calendar-year loss and LAE ratio of 85% is down 2 points from 2019 but is otherwise higher than any year since 2004. As noted earlier, declining reserve releases have driven this increase while the starting loss and LAE ratio has remained consistent in recent years.
 The starting loss and LAE ratio for each coverage year during the past decade has hovered between the high 80s and low 90s. The 2020 starting loss and LAE ratio is within this range at 90%. It is unclear at this stage whether the premium increases, specifically in 2019, will put the 2020 year in a stronger position than in other recent coverage years, especially with the increased uncertainty surrounding the impact of COVID-19 on patient interactions and reported claims.
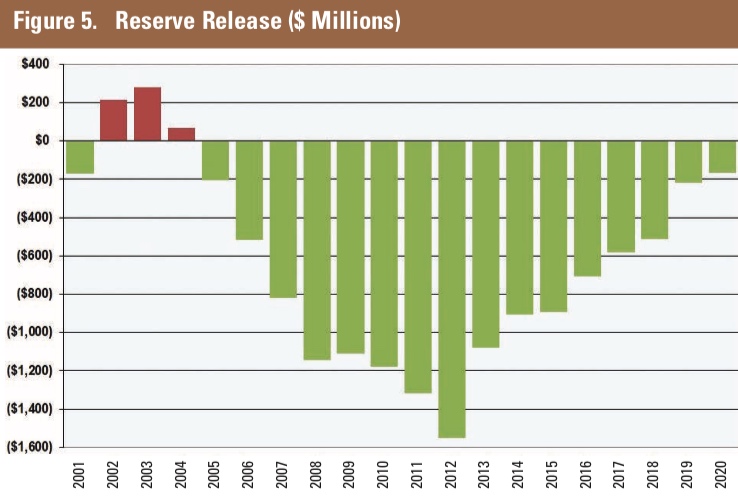
The slowdown in actual depositions taken reveals the impact of COVID-19 on insurers in 2020 (Figure 4). Using a proprietary database containing on average 16,000 open claims at any given time over the last two years, we saw nearly 6,200 fewer depositions taken in 2020 relative to 2019. This has a direct impact on the ability of insurers to move claims through the process, which led to fewer payments during 2020 than we otherwise would have seen. Therefore, we believe that payments were artificially lower in 2020 and it is our expectation that they will catch
up during 2021 and beyond.
Reserve releases
 The composite released less than $200 million in prior year reserves during 2020. This is the smallest release since the last adverse reserve development in 2004 and continues a trend of
diminishing releases that has been present since 2012 (Figure 5).
The composite released less than $200 million in prior year reserves during 2020. This is the smallest release since the last adverse reserve development in 2004 and continues a trend of
diminishing releases that has been present since 2012 (Figure 5).
A history of favorable calendar-year reserve development is not necessarily indicative of redundant reserves or even adequate reserves currently. A review of calendar-year development segregated by coverage year shows that favorable calendar-year reserve development has historically continued two to three years past the point when reserves were subsequently found to be adequate. Historical patterns would suggest the small amount of reserve development during 2019 and 2020 may indicate adverse reserve development in future calendar years.
Capitalization
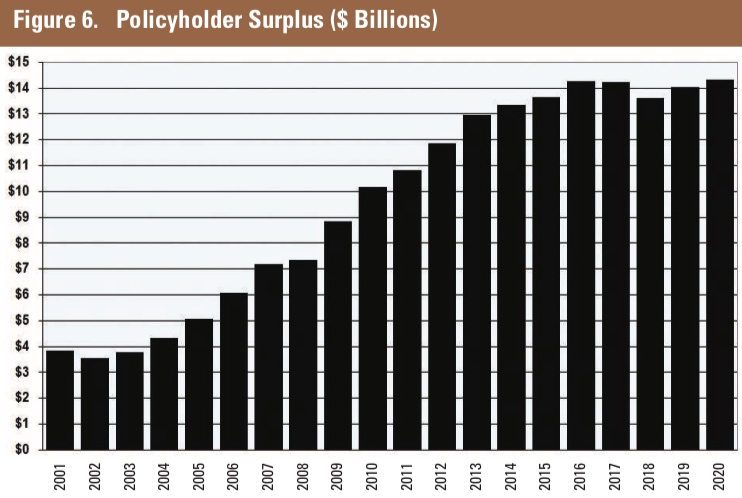 Despite underwriting losses, the composite’s surplus increased during 2020 from about $14.0 billion to $14.3 billion (Figure 6). As mentioned previously, this increase was due, in no small part, to record levels of realized capital gains. Net income for the composite contributed $335 million to the surplus growth, a low amount relative to the recent profitable run from 2005 to 2018, but much better than 2019, which saw net income of $100 million.
Despite the increase in surplus, the risk-based capital (RBC) ratio for the industry declined for the fifth consecutive year to the lowest level since 2010. The RBC ratio provides a comparison of a company’s statutory surplus to the minimum amount needed from a regulatory perspective. However, from a practical perspective, given market fluctuations, many would consider the practical minimum amount of capital needed to be well in excess of this regulatory minimum. Despite the recent decreases, the RBC ratio for the composite remains strong relative to that of most insurance markets, per results aggregated from S&P Global Market Intelligence.
Policyholder dividends
MPL writers continued to pay a significant amount of policyholder dividends in 2020. Collectively, the composite paid almost $170 million in policyholder dividends, representing about a third of its net income gross of policyholder dividends. This represents 4% of net earned premium, which continues a slow decline in recent years to the lowest policyholder dividends since 2006 (Figure 3). Cumulatively, however, the composite has paid $3.6 billion in policyholder dividends since 2005.
This steady stream of policyholder dividend payments, it appears, has recently been funded by the composite’s reserve releases. As reserve releases have dwindled, so too have the policyholder dividend payments. In 2020, for the first time since the current run of reserve releases started, the amount paid as policyholder dividends exceeded reserve releases for the composite.
Although from an absolute perspective, dividends have decreased in recent years, as a percent of net income they have been very healthy. During the 6-year period from 2007 to 2012, policyholder dividends averaged about 25% of net income. From 2013 to 2018 that percentage increased to about 33% of net income. The 2019 calendar year saw the composite pay dividends that were more than double its net income, and 2020 saw some reversion to the mean, though still higher than any year this century outside of 2019, at 50%.
A market with ample uncertainty
As the uncertainty surrounding COVID-19 begins to dissipate, ample uncertainty remains in the MPL market. We expect insurers will continue—or in some cases resume—taking rate action during 2021, increasing premium in an effort to improve underwriting results. Reserve releases will likely continue to dwindle, at least in the near term. At the same time, insurers face a multitude of risks, including:
- Possible increases in frequency and severity
- Residual effects from the COVID-19 pandemic
- Challenges to tort laws (e.g., another attempt to curtail California’s longstanding MICRA is rumored to occur in 2022)
- A potential renewed push for single-payer healthcare
- Competition from both non-specialty insurers as well as alternative markets as the market hardens.
Trillions of dollars have and will continue to flood into the economy as the full impact of the federal government’s COVID-19 response legislations come to fruition. It appears as though the COVID-19 relief stimuli have buoyed the stock market. It remains to be seen if the recent highs are temporary in nature or will continue to rise. There is also a potential for increased inflation. Inflation may adversely impact the bond portfolio on the asset side of the MPL balance sheet, while at the same time driving possible severity increases on the liability side.
Potential increases in unemployment will also increase uncertainty in the MPL market. If a larger unemployed population does not have access to employer-sponsored health insurance, that may lead to a decrease in patient visits and claim frequency. However, the experience of the 1980s would suggest higher claim frequency may result.
Regardless of the impact on claim frequency in the near future, it seems that reported claim frequency was down in 2020 since less nonessential medical treatment occurred. That, coupled with the delays in claim payments noted above, may result in the 2020 coverage year appearing better than expected for some companies. As we note above, this may be more of a mirage than an oasis, and the appearance of improved data may make it difficult for MPL companies to
gain approval for the rate increases needed to stabilize and improve underwriting results.
Finally, with the postponement of nonessential medical care, there is potential for a higher claim frequency in the coming years. Missed diagnoses, first visits with patients having more severe medical issues than normal, and the emergence of telehealth all increase the uncertainty—and perhaps the potential for more claims—in the MPL industry.