On the whole, the medical professional liability (MPL) sector is currently perceived to be in an excess capital position. This is defined as holding more capital than regulators and rating agencies require. Insurers are required to retain capital to cover potential losses and meet obligations to their shareholders.
Many companies hold a significant capital buffer compared to the level required to support their current rating and financial objectives. This prompted the following questions relevant to MPL insurers:
How durable is the excess capital position of the MPL marketplace?
What realistic scenarios could reduce capital in a way that would change rating agency or company behavior?
To answer these questions, we first assess year-over-year-surplus changes in 2022 and then take a deep dive into stress testing insurers’ balance sheets and AM Best’s Capital Adequacy Ratio (BCAR) scores. These scores describe the quantitative relationship between the strengths of an insurer’s balance sheet and the key financial risks that could potentially impact that balance sheet.
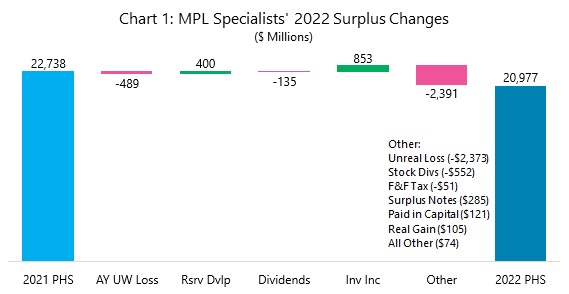
2022 Decline in Policyholder Surplus (PHS)
During 2022, underwriting losses persisted, and investment values declined, creating a challenging year for insurers’ balance sheets. In aggregate, MPL specialists, which we define as insurers that write at least 80% of direct written premium in MPL, recorded an underwriting loss of $224 million, including policyholder dividends. This resulted in a combined ratio of 103.0%. This represents 1.0% of 2021 surplus, before tax. On an accident year basis, the combined ratio was 109.2%.
In recent years, the underwriting losses were more than offset by investment income and asset value appreciation. However, asset returns were negatively impacted in 2022. Equity values declined significantly, with the S&P 500 down 18.1% with reinvested dividends. This is the steepest decline since 2008. Additionally, the Federal Reserve raised the federal funds rate seven times in 2022. The rise in interest rates led to significant unrealized losses on fixed income portfolios. While on-balance-sheet PHS is not affected within statutory accounting statements, rating agencies typically adjust for the unrealized loss position in their capital models. Chart 1 represents year-over-year-surplus changes for MPL specialists, resulting in an aggregate decline of $1.8 billion, or 8%.
Looking at 2023 and beyond, there is reason for optimism on the asset side. With regards to equities, dating back to 1950, the S&P 500 only dropped in the year following a decline three times: 1974, 2002, and 2003. For fixed income securities, absent a shock loss, we expect MPL insurers to hold fixed income securities to maturity. As these investments mature and new float becomes available, insurers will benefit from higher reinvestment rates.
Stress-Testing the Balance Sheet
In order to stress-test the balance sheet of MPL insurers, we focus on AM Best’s MPL composite of companies, which is composed of 34 statutory groups and unaffiliated entities. We exclude trusts, companies rated on a GAAP basis, and companies recently acquired. We aim to capture the impact on insurers’ capital adequacy by using the BCAR model at the VaR 99.6 confidence interval, as most AM Best rated carriers manage to this interval.
For this analysis, we focused on underwriting risks and excluded investment and credit risks, as underwriting risks are inherently more manageable on an individual company level. The following risk scenarios were selected based on our knowledge of historical risk factors and discussions with our clients and reinsurance partners about current market conditions:
- The impact of a single aberrant shock loss, outside of policy limits and above a carrier’s excess of loss reinsurance treaty.
- Reserve development across multiple historical report/accident years. We then considered the impact of reserve changes over a single calendar year and over a three-year period.
We review these scenarios independently, assuming that only one will happen at a time. The impacts described would be additive if more than one event occurred simultaneously. As a baseline view, we estimated BCAR using year-end 2022 financial statements.
Shock Loss. During 2023, there were several headline verdicts greater than $50 million. Such shock losses are difficult to predict. In our experience, such events are not strongly correlated to the original policy limit, exposing even small carriers that write low-limit business. There are likely exceptions to this rule in states with strong tort reform or carriers with some form of bad faith immunity.
For this stress scenario, we selected a net retained loss amount of $30 million. This selection was arbitrary but is illustrative. The exact net retention would vary by company based on reinsurance structure.

The risk to capital position from this kind of event is directly related to the size of the insurer. Small carriers with less than $200 million of policyholder surplus (PHS) are most at risk if faced with this kind of loss. Table 1 shows that 70% of small companies would experience a BCAR decline of more than 10% versus just 10% of medium companies and zero large companies. Chart 2 shows the individual company detail.
Adverse Reserve Development. To measure the range of potential adverse reserve development, we analyzed statutory Schedule P MPL claims made and MPL occurrence data from 1996-2022 with data from S&P Capital IQ. We selected all carriers that were predominantly MPL focused or that wrote more than $100 million of MPL premium at some point during the period.
We compiled the Schedule P reserve development for each company over one-year and rolling three-year periods.
We calculated the distribution of reserve changes as a percentage of prior year-end reserves. For claims-made data, we split out larger companies as we observed lower volatility. There was not enough data to make a similar split for occurrence data. Chart 3 shows the observed adverse development and various tail scenarios.
An example of how this table can be interpreted: In a one-year period, a large company in the study has a 5%—one in 20—chance of claims-made reserves increasing by more than 13%. Over a three-year period, the same large company has a 5% chance of claims made reserves increasing by more than 27%. These total reserve changes may seem large, but they are in line with what many carriers experienced in the early 2000’s.
For our stress scenarios, we considered the impact of the 95th percentile reserve development to 2022 year-end reserves, net of reinsurance. The risk to capital position from this kind of event is not directly tied to company size. Small carriers tend to have lower reserve leverage, which is the ratio of booked reserves to capital, while experiencing higher volatility. Larger insurers benefit from lower volatility but have already reflected this lower volatility by increasing reserve leverage. This makes them vulnerable to a relatively smaller increase in reserves.
We should note that the three-year scenario is likely too pessimistic. Most carriers would not stand still in the face of major reserve increases: Current-year pricing would increase, underwriting would tighten, and new business might be restricted if policyholder surplus became stressed. Figures 4 and 5 show the distribution of BCAR decreases due to changes in reserves. The companies that experience less than a 5% increase can be characterized as having low reserve leverage, high net investment income, and combined ratios near 100%.
Results Highlight the Importance of Stress-Testing
MPL-focused carriers are generally well capitalized despite recent changes in interest rates and equity market prices. Underwriting and reserve stability have helped many companies increase their surplus over the past decade to levels that are significantly higher than the industry held during the last hard market. That capital will protect companies in the face of many risks, but it does not make them invincible.
Reasonably foreseeable losses, similar to large individual losses experienced in recent years or reserve development similar to the early 2000’s, would put pressure on the capital position of many carriers. The study results highlight the importance of stress-testing and assessing risk tolerances within a company’s overall enterprise risk management (ERM) framework.