In many respects, 2025 extended the medical professional liability industry’s recent trajectory, but with a slower pace of top-line growth and clearer evidence of post-pandemic claim normalization. Composite direct written premium increased 1.7% to more than $6.9 billion, the highest level since 2006; however, the rate of growth was the lowest since 2020. Meanwhile, the premium mix continued its long-running shift away from physicians toward hospitals and other facility-based risks, reflecting the ongoing migration of exposure to hospital- and facility-employed physician settings.
Underwriting results remained pressured. Prior-year reserve releases were again modest—about $190 million, consistent with 2024 and in line with the “new normal” range seen since 2019—providing a smaller tailwind than the sizable releases common in the prior decade. Combined ratios stayed above 100%, underscoring that underwriting has not yet produced consistent profitability and that overall results continue to rely meaningfully on investment income. Even so, improved investment performance over the last two years helped deliver modestly better operating results than those posted from 2021 through 2023.
At the same time, balance sheets strengthened further. Policyholders’ surplus rose nearly 5% in 2025, and the composite’s risk-based capital (RBC) ratio increased to nearly 1,200%, reinforcing the industry’s strong capitalization despite continued underwriting losses. Policyholder dividends remained consistent with the past five years but appear increasingly deemphasized relative to earnings.
Loss trends in 2025 continued to reflect the aftereffects of COVID-era court disruptions. While open-claim counts appear to be declining, unpaid loss and LAE reserves have grown—up about 10% since 2021—implying rising average unpaid severity. Multiple indicators suggest the system has largely returned to an operating “equilibrium” in trial activity, but the industry is still working through a backlog: Since late 2022, payments have consistently exceeded long-term trend levels, and claim durations for closures from 2022 through 2025 are nearly 25% longer than for claims closed from 2018 through 2021. These extended timelines likely contributed to higher indemnity and defense costs, supporting both elevated carried reserves and the recent increase in loss payments.
Our view of the current MPL market is based on the statutory financial results of a composite of 74 of the largest specialty writers of medical professional liability insurance coverage. Using statutory data from S&P Global Market Intelligence, supplemented with Milliman Datalytics–Defense, we compiled industry metrics across:
- Written premium
- Reserve releases
- Overall operating results
- Capitalization
- Policyholder dividends
When interpreting these results, it is important to recognize that the composite reflects only established MPL specialty writers. We exclude:
- Specialty writers that became insolvent or otherwise exited the market
- Multi-line commercial carriers
- Smaller MPL writers.
These excluded groups are generally less well-capitalized than the 74 companies included here, and multi-line commercial carriers—along with some smaller writers—have typically produced less favorable underwriting results. Insolvent carriers, by definition, also reflect weaker outcomes.
Accordingly, the results presented are best viewed as the experience of the established specialty segment of the MPL market, and they will generally appear more favorable than metrics that attempt to represent the entire MPL industry.
Written Premium
In 2025, the composite’s direct written MPL premium rose 1.7%, lifting total volume above $6.9 billion, its highest level since 2006 (Figure 1). However, this growth rate is one-point less than the average annual increase recorded from 2022 through 2024. This lower growth rate is consistent with the overall rate activity during 2025, as fewer companies took rate increases in 2025 compared to 2024, while the average increase was below that of 2024, according to Medical Liability Monitor’s Annual Rate Survey. Additionally, the shift toward captive insurance companies and other alternative risk vehicles continues to mitigate top line revenue growth within the statutory MPL industry.
Figure 1
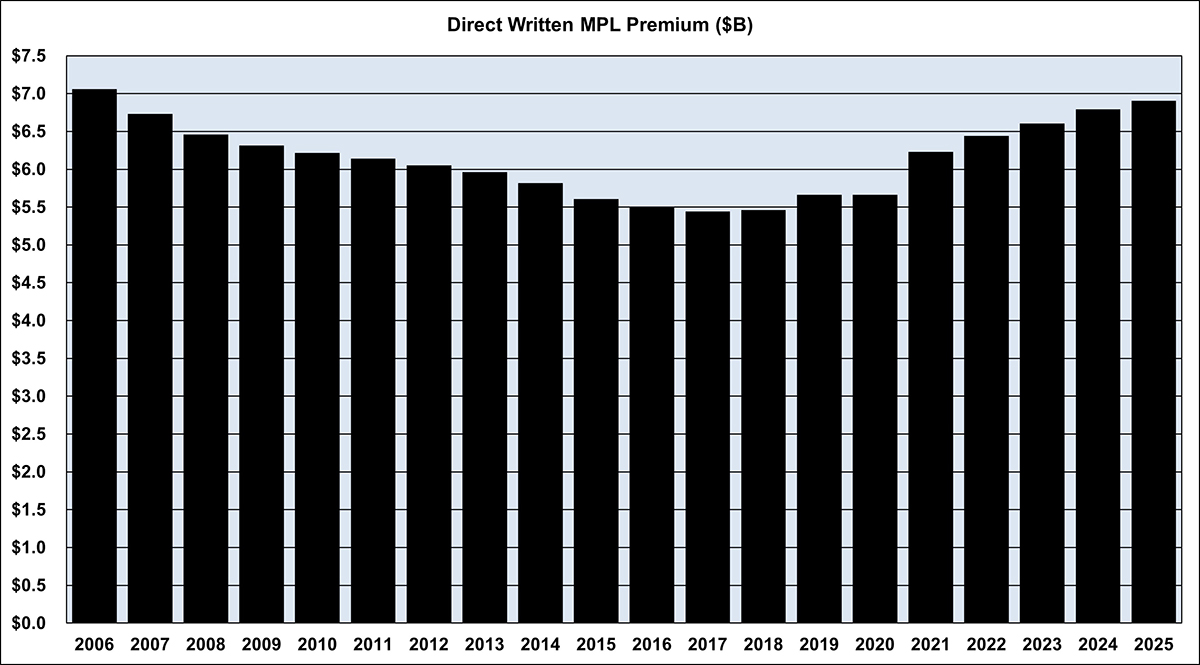
The composite’s direct written premium mix continues to shift away from physicians and toward hospitals, other professionals, and other facilities. In 2025, physicians accounted for 69% of MPL direct written premium, while hospitals, other professionals, and other facilities represented approximately 14%, 14%, and 3%, respectively. By comparison, a decade ago physicians comprised 80% of the composite, with hospitals, other professionals, and other facilities at 9%, 10%, and 1%. This change highlights a redistribution of who bears MPL risk and reflects the ongoing migration of premium to hospital- and facility-employed physician settings.
Reserve Releases
The composite released roughly $190 million of prior-year reserves in 2025, in line with 2024. This marks the seventh straight year of reserve releases in the $175 million to $350 million range, suggesting a potential “new normal.” By contrast, from 2007 to 2018 the smallest reserve release was $700 million, and the average annual release was about $1.2 billion. (Figure 2)
Figure 2
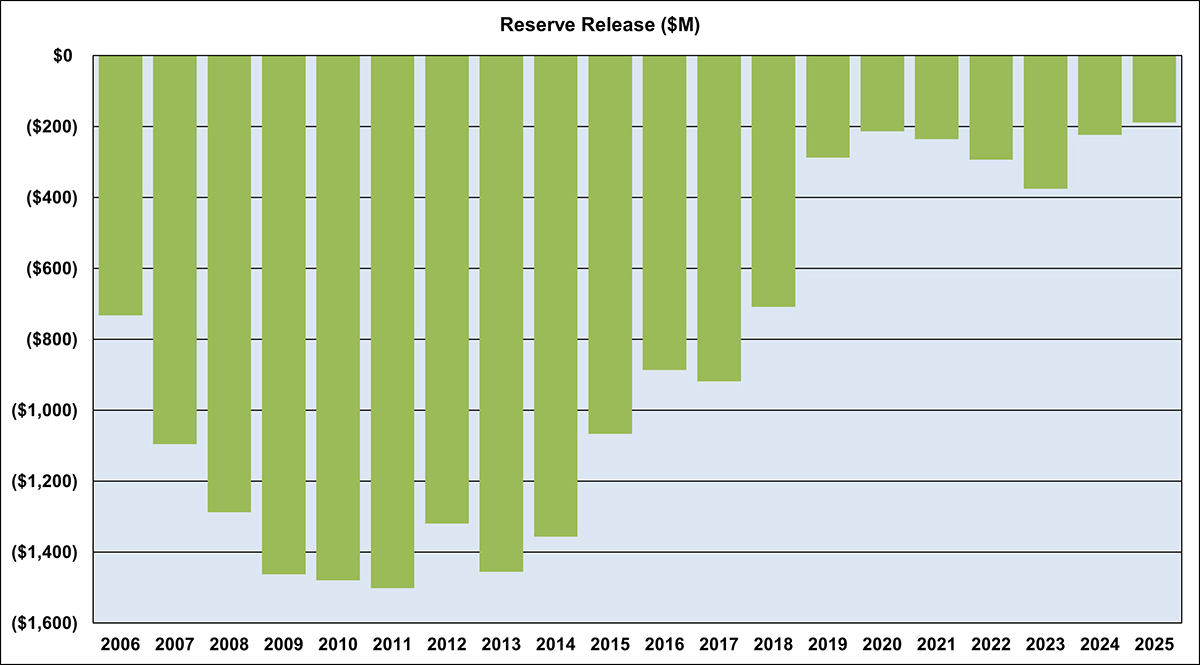
Although recent reserve releases are smaller than those seen in the prior decade, the composite’s unpaid loss and loss adjustment expense (LAE) reserves have continued to grow. Since 2021, loss and LAE reserves have increased by about 10%, reaching more than $17 billion in 2025. This increase comes even as the number of open claims appears to be declining. Schedule P, Part 5 indicates open claim counts fell by roughly 10% over the same period. Taken together, these movements imply that average unpaid severity has risen by approximately 4% per year. Possible drivers include social inflation, lingering effects from COVID-era litigation delays, or other factors. One area we can evaluate more closely is the COVID-related impact.

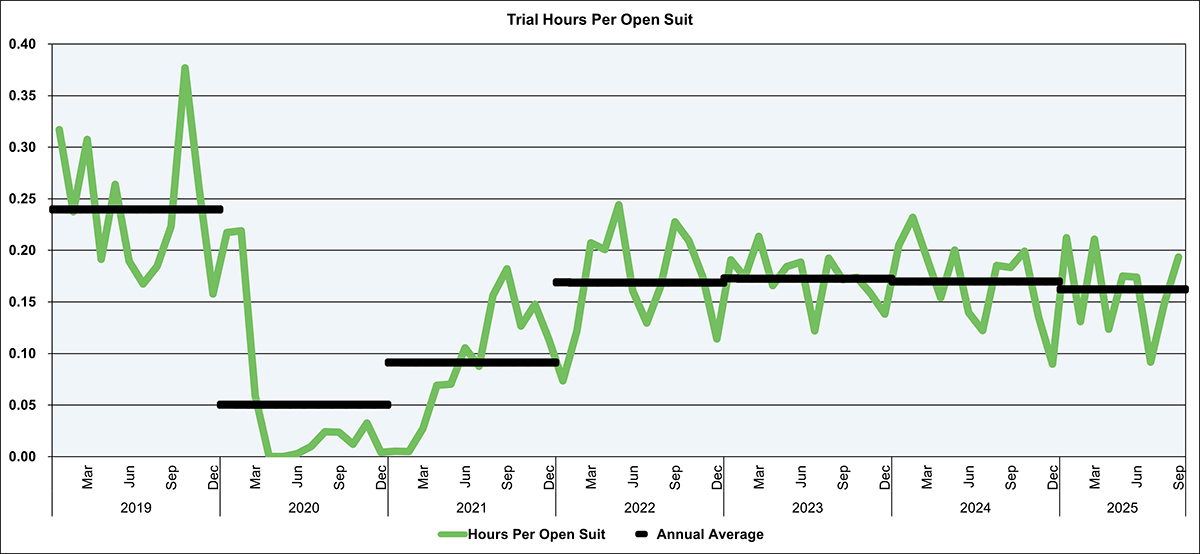
As in prior years, the effect of the pandemic on court activity is evident in attorney-invoiced trial attendance and travel hours per open claim (Figure 3). Using a proprietary dataset that has tracked roughly 25,000 open claims on average at any point over the past seven years, trial hours were close to zero for nearly 12 months spanning 2020 and early 2021. Beginning in March 2021, trial hours gradually increased and have since stabilized at an apparent equilibrium. The sharp reduction in trial activity during 2020 and 2021 constrained insurers’ ability to close claims, contributing to lower industrywide payments during that period, consistent with prior findings.
Figure 3
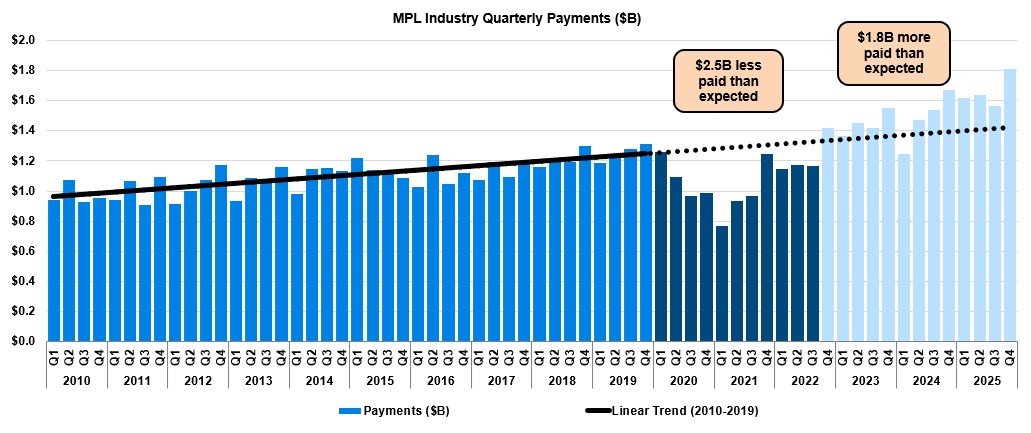
Trial hours also appear to move in tandem with NAIC Quarterly Statement payment data. From the first quarter of 2020 through the third quarter of 2022, payments declined materially, in part reflecting COVID-related court slowdowns and closures. During this time, total payments were approximately $2.5 billion lower than the long-term trend would have indicated. Since the fourth quarter of 2022, however, payments have consistently exceeded what the long-term trend would suggest by approximately $1.8 billion—another indication that insurers are working through a backlog of open claims but have not yet made up for the shortfall (Figure 4).
Figure 4
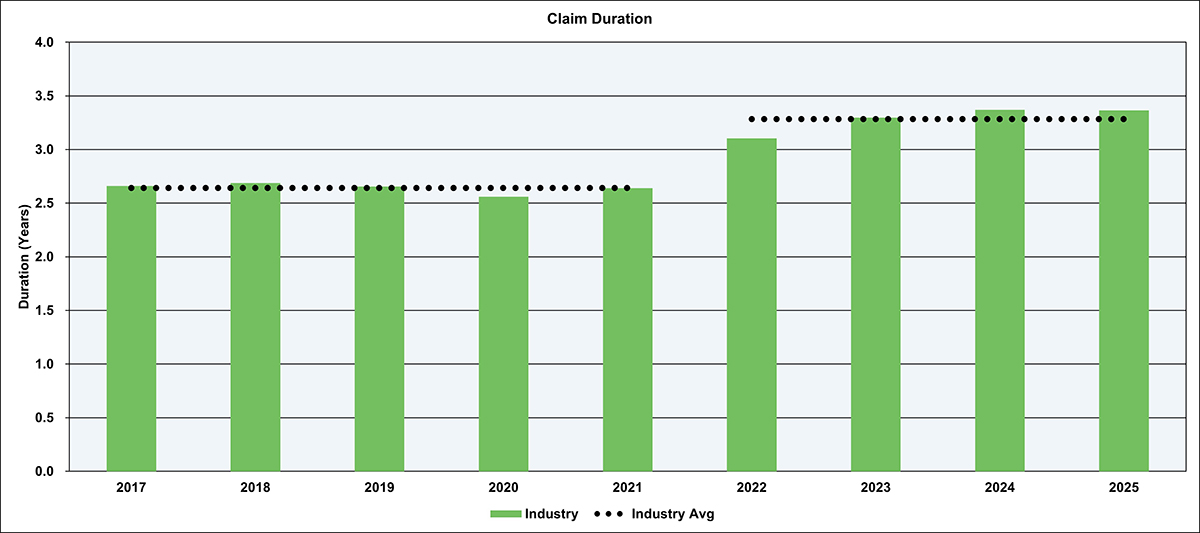
These disruptions also extended claim timelines. The average duration of claims closed from 2022 through 2025 (measured from report date to close date) is nearly 25% longer than for claims closed from 2018 through 2021 (Figure 5). This analysis draws on the same proprietary database, which includes more than 12,000 closed claims per year on average. Overall, COVID-era slowdowns not only kept reserves on the books longer but may also have contributed to higher severities—through both indemnity and defense costs—supporting the increase in carried reserves and the recent elevation in loss payments.
Figure 5
Overall Operating Results
After removing certain companies from the 2024 and 2025 operating ratio calculations because their realized capital gains were material outliers (with an impact of 18 points and 10 points, respectively in 2024 and 2025), the operating ratio for the past two years is modestly better than the results posted from 2021 through 2023 (Figure 6). Over this period, the calendar-year loss ratio and underwriting expense ratio each rose by about one point, while the calendar-year LAE ratio and policyholder dividend ratio were largely unchanged. Netting these movements, the combined ratio increased by roughly two points. Even so, improved investment results in the last two years helped offset underwriting pressure and created a better operating ratio.
Figure 6
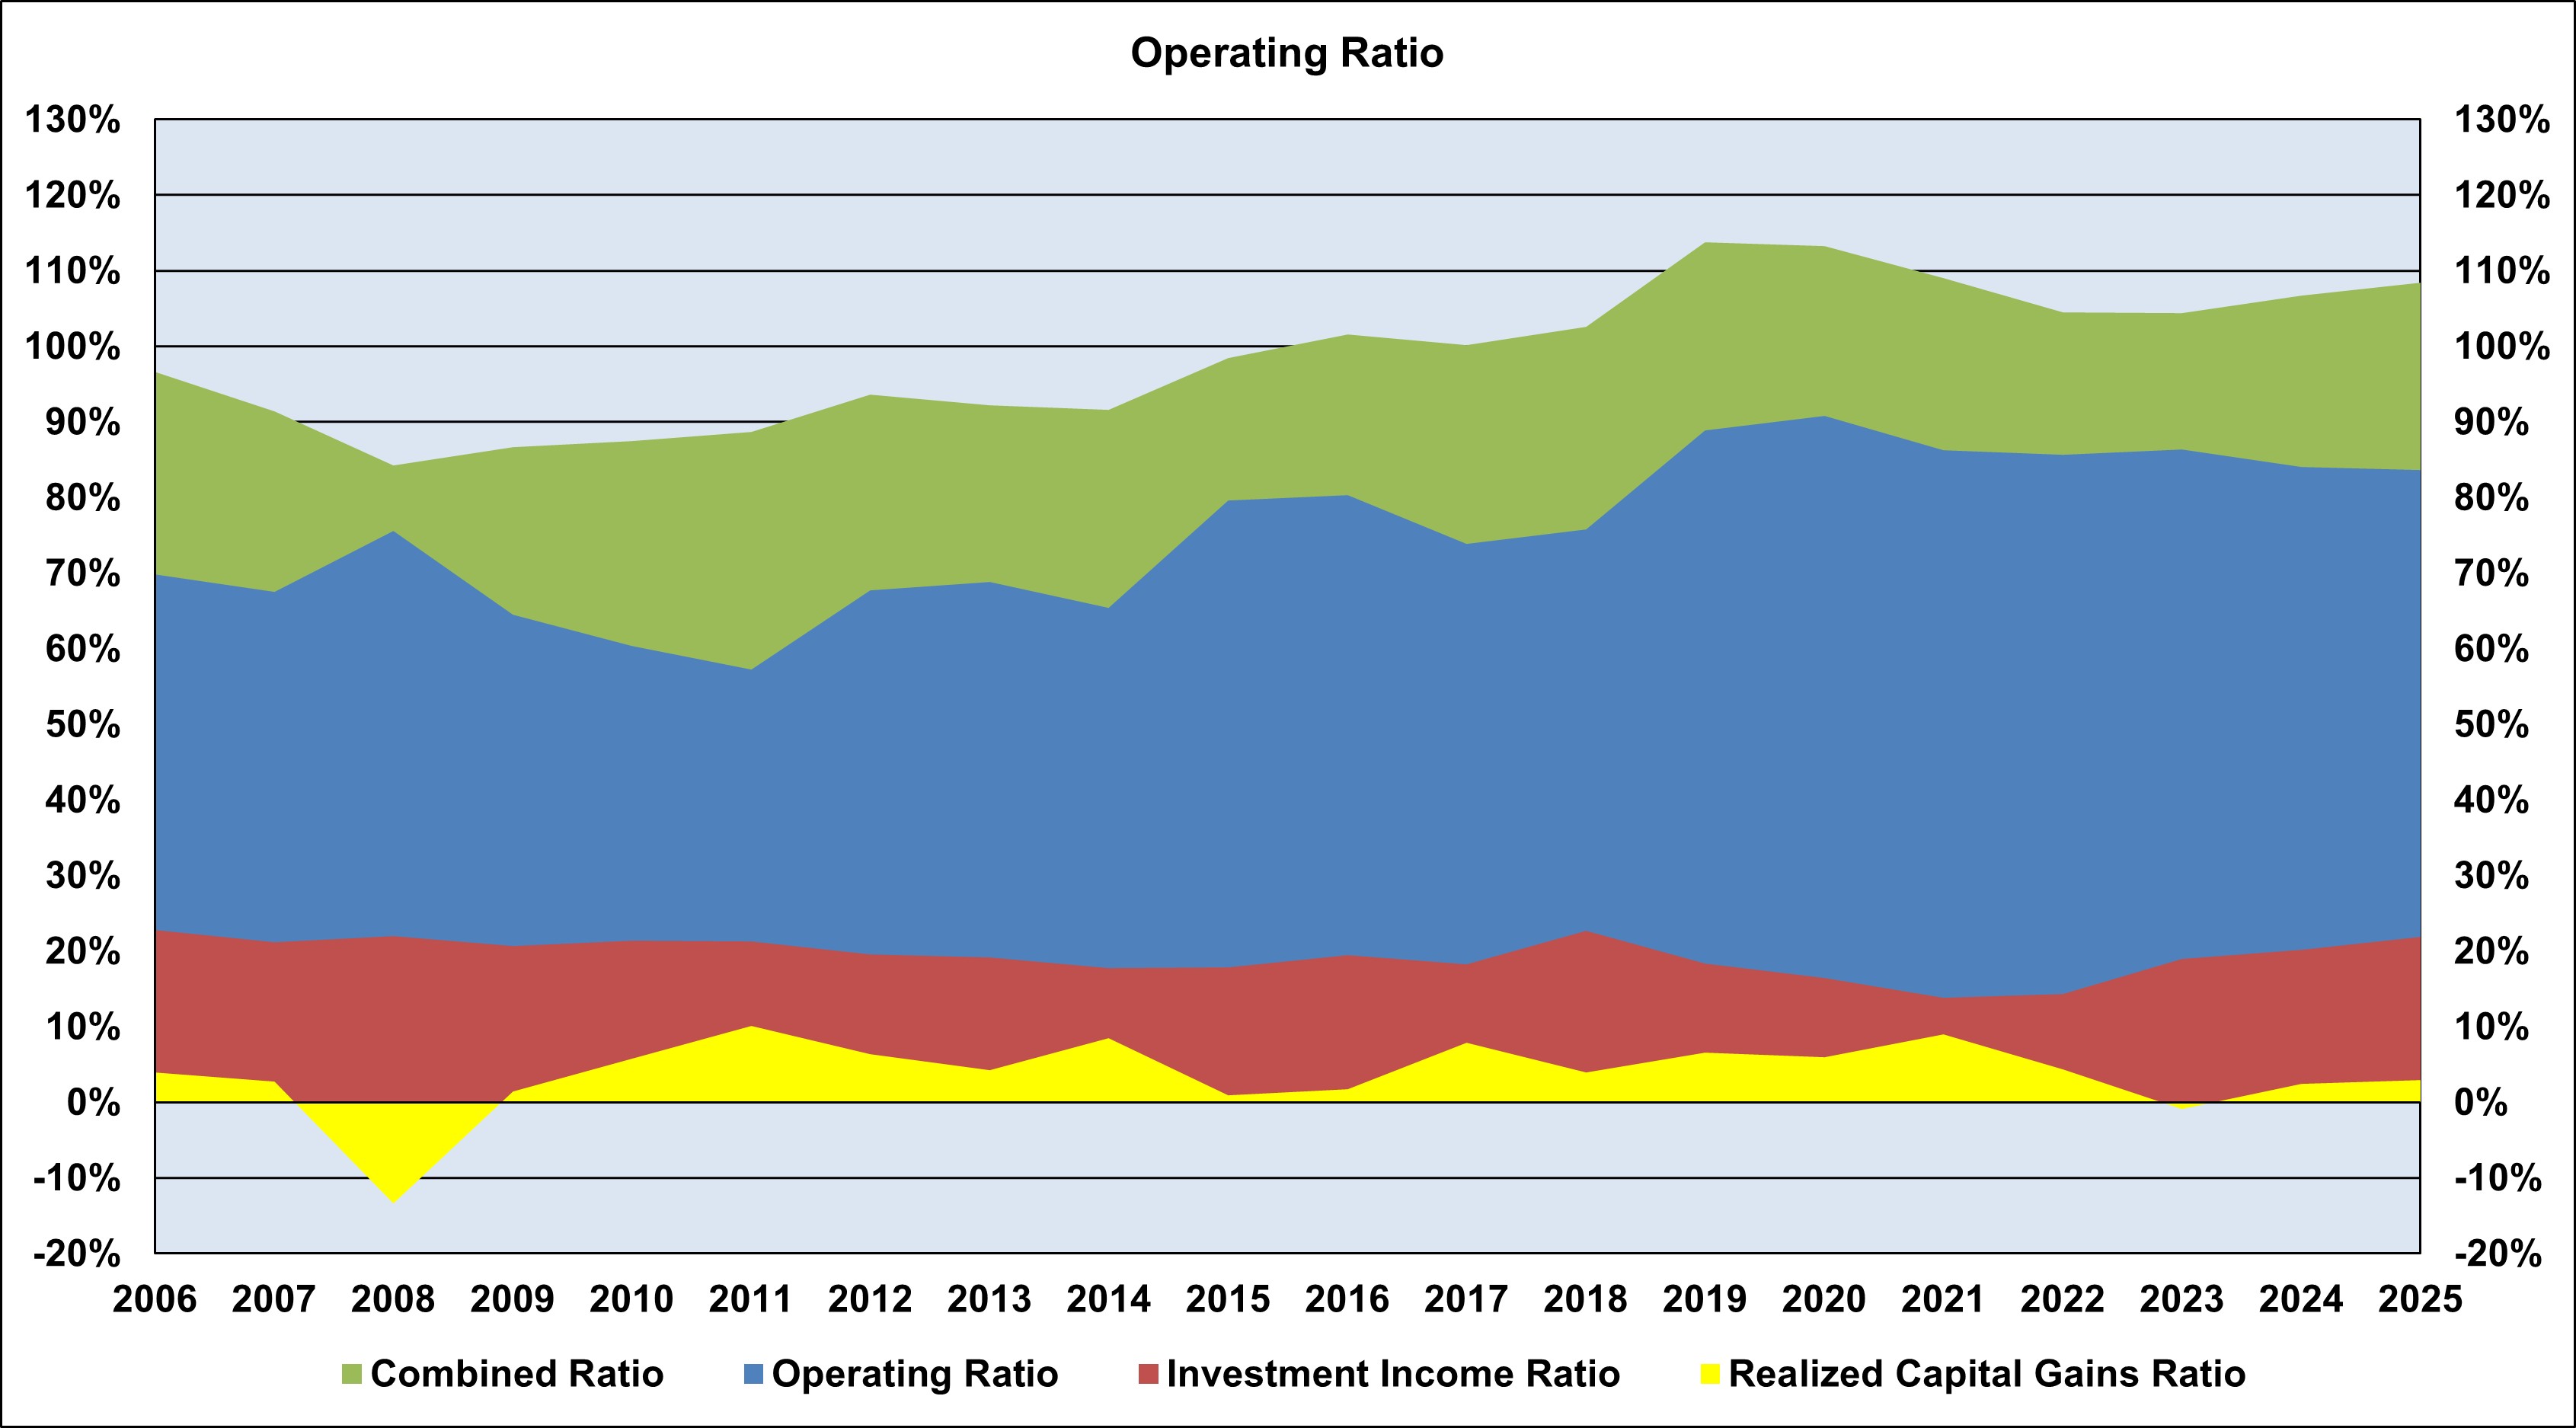
As noted earlier, reserve releases have been relatively steady since 2019. The operating ratio benefit—averaging 4% over the last five years—remains well below the double-digit reserve release impact seen from 2006 through 2018, which often exceeded 20%. Combined ratios have remained above 100% since 2016 (Figure 6), underscoring the composite’s continued dependence on investment income to generate overall profitability.
The composite’s 2025 initial coverage year loss and LAE ratio was 83%, consistent with each of the prior three years. This recent level is meaningfully below the roughly 90% average observed for 2021 and earlier years. A lower starting loss and LAE ratio likely reduces the likelihood of large reserve releases and may help explain why releases have been smaller in recent years.
Capitalization
Policyholders’ surplus increased by roughly 5% in 2025, reaching $23.4 billion (Figure 7). Industry surplus continues to rise despite underwriting losses reflected in combined ratios above 100%, as investment income has rebounded from the lows seen between 2020 and 2022.
Figure 7
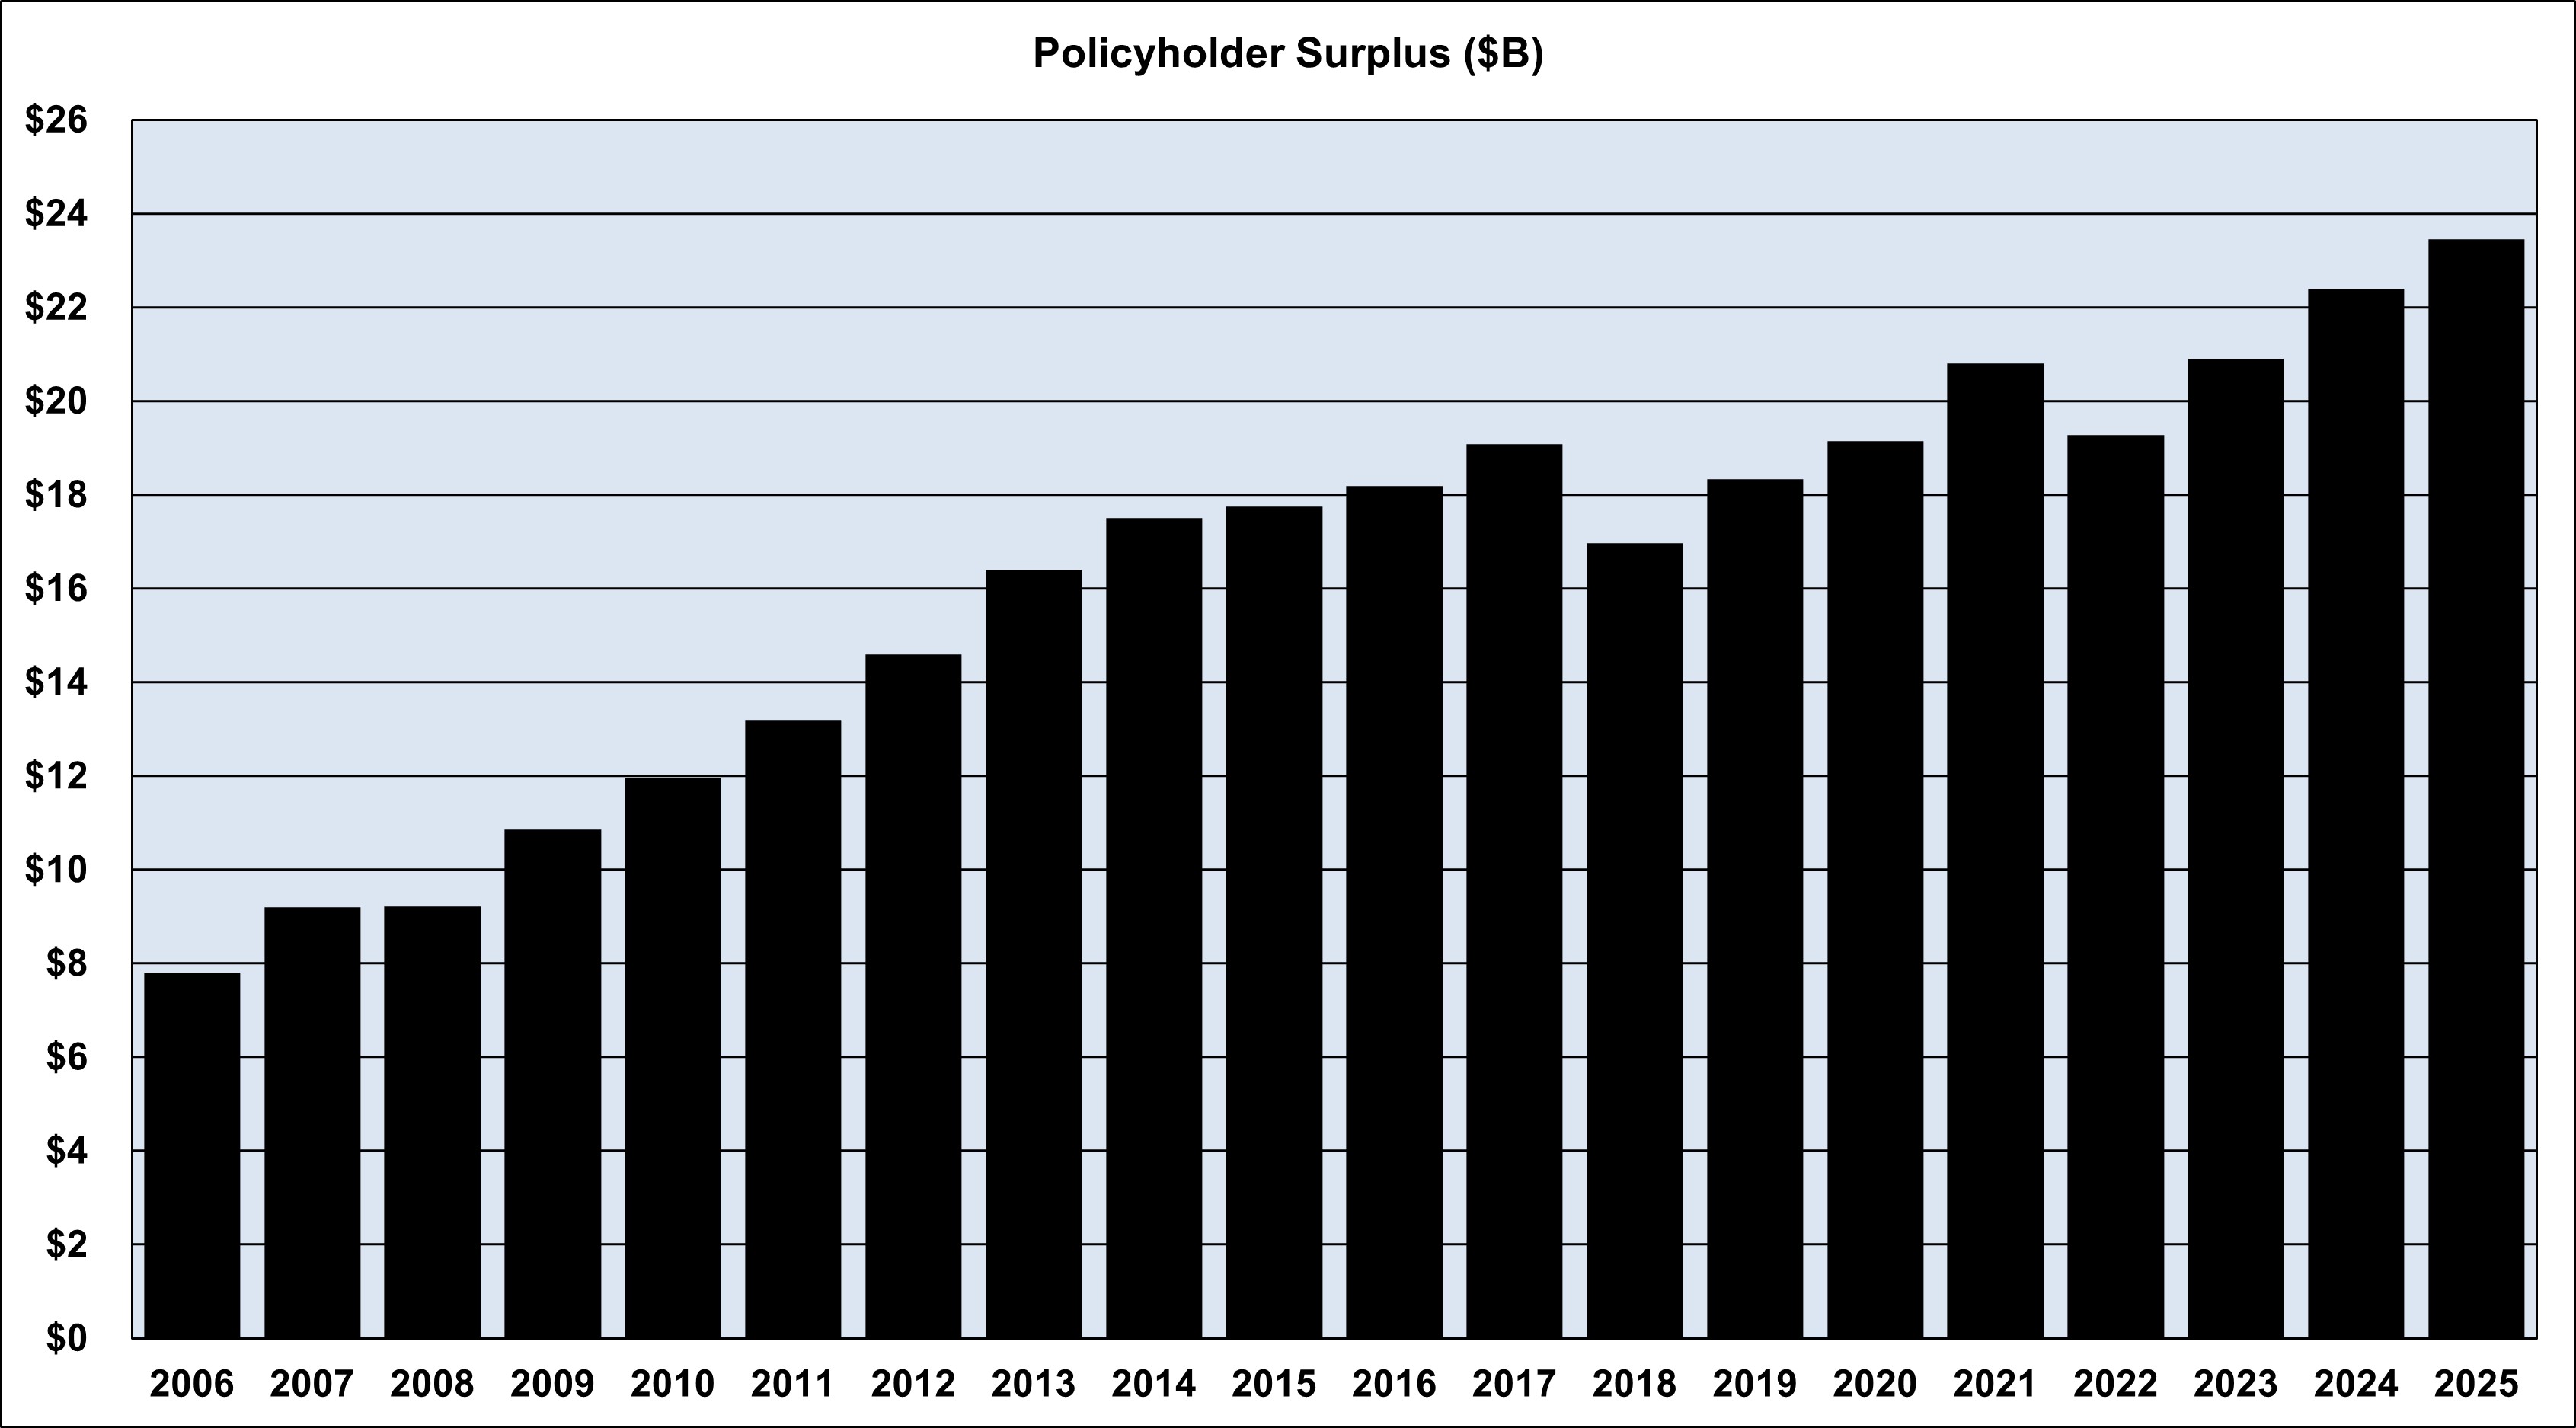
The composite also remains well capitalized. Based on S&P Global Market Intelligence aggregates, its RBC ratio is strong relative to most other insurance segments. The RBC ratio compares statutory surplus to the regulatory minimum required capital (though companies typically target capital levels well above the minimum in practice). In 2025, the composite’s RBC ratio rose by about 100 points to nearly 1,200%.
The relative surplus strength of the composite begs the question: In what ways should companies deploy their capital to best serve their constituents and/or the healthcare industry more broadly? Will additional investments be made in artificial intelligence, alternative data sources, defending state tort reforms, operational efficiencies, or pricing strategies?
Policyholder Dividends
Policyholder dividends for the composite have been relatively consistent over the past five years, averaging about $140 million annually. That level is roughly 50% below the average dividend paid from 2007 through 2018. Historically, these dividends were likely supported in part by reserve releases, which—as noted earlier—have been lower in recent years.
Since 2007, dividends to policyholders have typically represented about 15% to 20% of pre-dividend net income. Over the last two years, that share has declined to under 10%. Overall, the composite has been deemphasizing policyholder dividends, potentially until underwriting results strengthen.
What’s Next?
Moving into 2026, the MPL landscape is being shaped by continued tort reform activity, with multiple states revisiting damage caps and litigation rules. These changes add uncertainty and could shift both claim frequency and severity, often unevenly by venue and line of coverage.
Even with that variability, the industry remains resilient and well-capitalized. Recent improvement in operating ratios, driven largely by stronger investment income, demonstrates financial flexibility, but it also reinforces a key challenge: Underwriting results have not yet delivered consistent profitability, leaving the sector more dependent on market and rate-cycle conditions.
Strategically, carriers will need to pair legislative monitoring with disciplined underwriting and claims execution. That includes scenario testing for venue-specific reforms, aligning pricing and attachment points to emerging severity trends, and continuing to invest in claims analytics and defense management to manage duration and expense. The insurers that adapt fastest—translating legal and economic shifts into timely product, pricing, and risk-management actions—will be best positioned to stay competitive and profitable as the environment continues to evolve.